|
Over the last few months, I have started exploring around the realms of data analysis ( both qualitative and quantitative), finding trends and patterns and at the end presenting each elements as a piece of the cohesive story! For the " proof of concept" here is an example from the Divvy dataset. Project Dashboard Project overview: I have tried to answer the following questions:
Analysis: I prepared the data through MS Excel and DAX functions. Key takeaways:
Postscript : ELVTR chose one of my data visualizations to be featured in their course, woohoo!!! Link to site 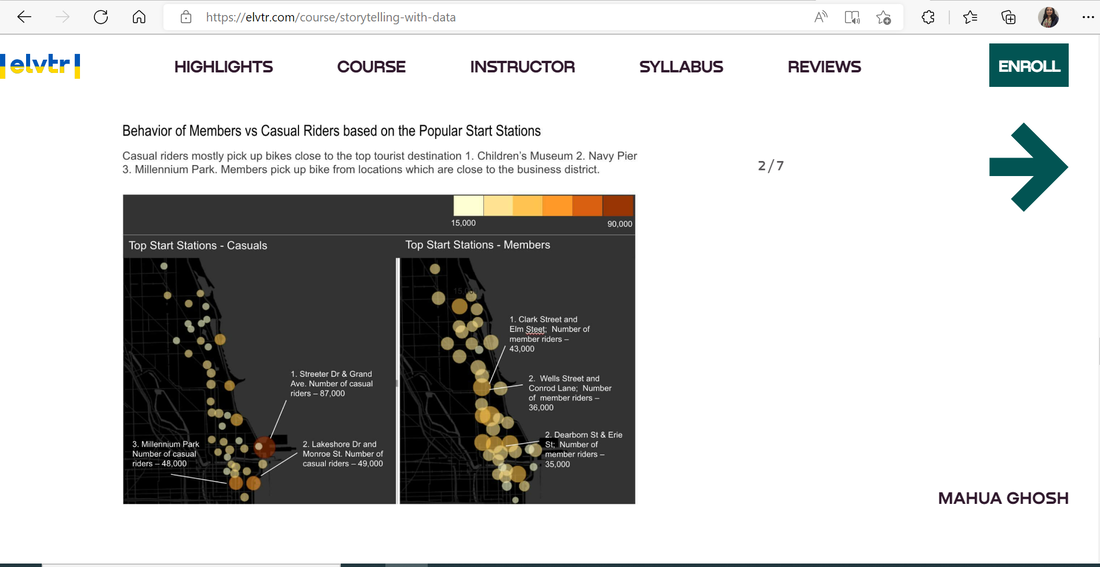
0 Comments
|
Archives
July 2022
Categories
All
|
 RSS Feed
